
Date: Apr 2026
Owning the right assets is necessary; but it is not sufficient. The weights you assign to each asset determine as much of your outcome as the assets themselves. Two investors holding the exact same four assets in different proportions will experience materially different returns, different volatility and a different probability of reaching their goals. Portfolio optimisation is the process of finding the weight combination that delivers the best possible return for a given level of risk. It does not require different assets. It requires a better understanding of how existing assets interact and a disciplined method for exploiting that structure
Before optimising, it is essential to understand the correlation structure of the assets in the portfolio. Correlation determines how much diversification benefit is available and therefore how much an optimiser must work with. Across 3-year rolling returns from January 2011 to March 2026, Nifty 50 and 10Y GSec carry a negative correlation of -37%, meaning when domestic equities underperform, bonds tend to hold. Nifty 50 and Gold INR are modestly negative at -4%. S&P 500 INR and 10Y GSec are mildly positively correlated at +13%, while S&P 500 INR and Gold INR move together at +54% limiting diversification between the two. These relationships give the optimiser meaningful room to reduce portfolio volatility while improving return.

*Source: NSE & Investing.Com (Data from January 2011 to March 2026)
Low and negative correlations are the raw material that optimisation works with. The optimiser’s job is to combine these assets in the proportions that extract the maximum return for the minimum risk given how they move relative to each other.
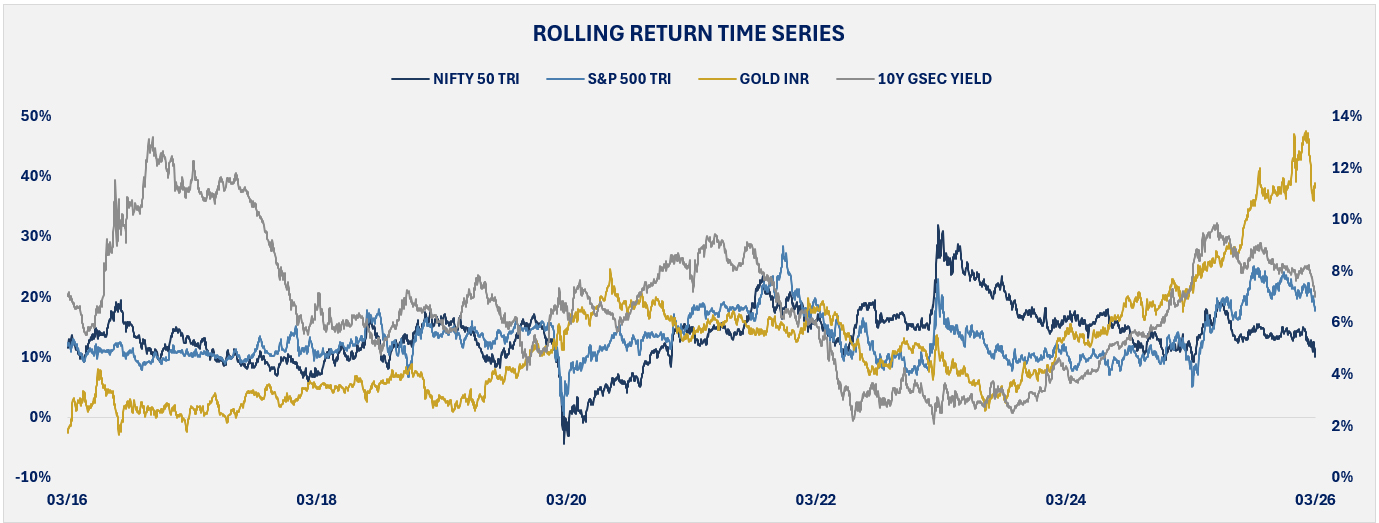
Over the 15-year period, Nifty 50 averaged a 3-year rolling CAGR of 13.6% with a standard deviation of 4.7%, reflecting India’s sharp equity cycles. S&P 500 INR averaged 13.2% at a tighter 4.0% dispersion. GSec delivered 6.7% with the lowest volatility at 2.5%; steady and negatively correlated with equity. Gold averaged 12.0% but with the widest dispersion at 9.6%, ranging from -2.9% to 47.6%; its median of 10.5% versus mean of 12.0% signals that returns are driven by a handful of exceptional windows rather than consistency. The countermovement between these assets is what the optimised portfolio is built around.
*Source: NSE & Investing.Com (Data from January 2011 to March 2026)
The divergence between asset cycles is the opportunity optimisation exploits. When one asset falls, others hold or rise and the optimiser finds the weights that make this offset work most efficiently.
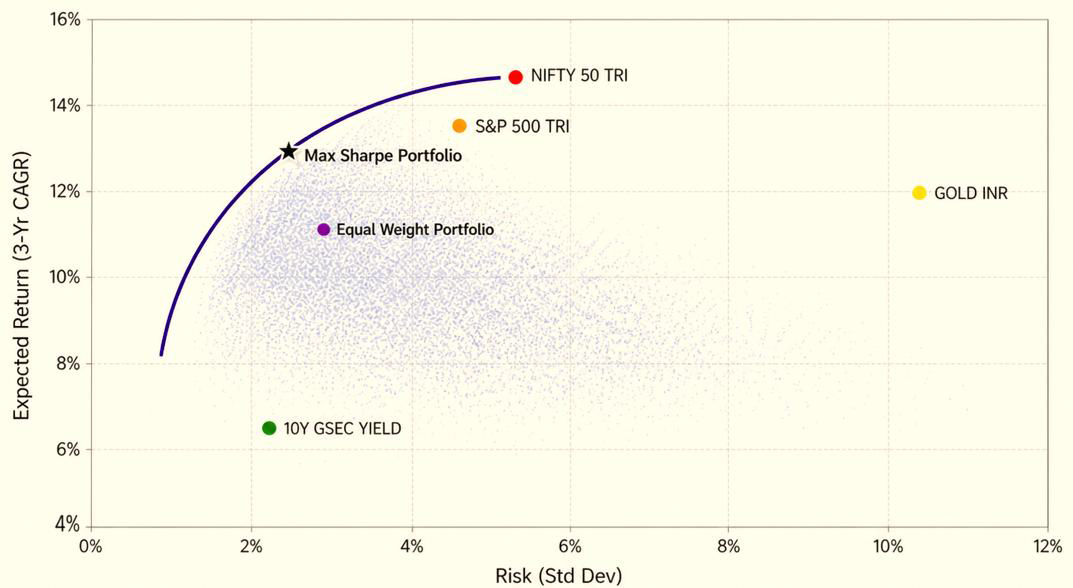
The chart below plots 8,000 randomly constructed portfolios across the same four assets. Every dot is a different weight combination. The efficient frontier which is the upper-left curve represents the only allocations worth holding. Any portfolio below it either carries more risk than necessary for its return or earns less return than available for its level of risk.
*Source: NSE & Investing.Com (Data from January 2011 to March 2026)
Note: This chart is a simplified visual illustration of how an efficient frontier looks and how diversification can improve the risk return profile of a portfolio. It is not intended to represent an exact or investable allocation.
The naive equal-weight portfolio sits inside the cloud and our portfolio sits on the efficient frontier with a Sharpe ratio of 1.95 versus 1.44 for the equal weighted allocation. That is a 35% improvement in return per unit of risk. Both portfolios use the same four assets. The only difference is the weight per asset.
The optimised portfolio holds Nifty 50 at 40%, S&P 500 at 35%, GSec at 20% and Gold at 5%. Domestic equity anchors the portfolio at 40%, with S&P 500 as a meaningful international allocation at 35%. GSec at 20% provides the negative correlation anchor against domestic equity and Gold at 5.0% adds tail protection at its minimum allocation.
*Source: NSE & Investing.Com (Data from January 2011 to March 2026)
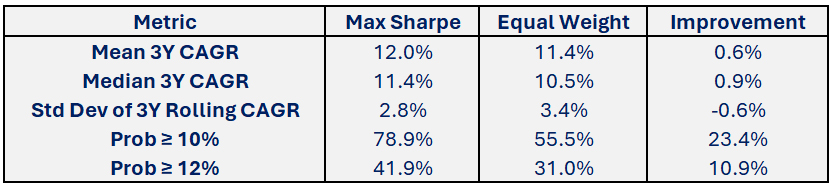
The probability of achieving a 12% CAGR over any 3-year rolling period rises from 31.0% to 41.9%. The 10th percentile outcome, meaning the floor investors experience in the worst decile of rolling periods, improves from 8.2% to 9.1%. These are the direct consequences of moving from arbitrary weights to mathematically determined ones.
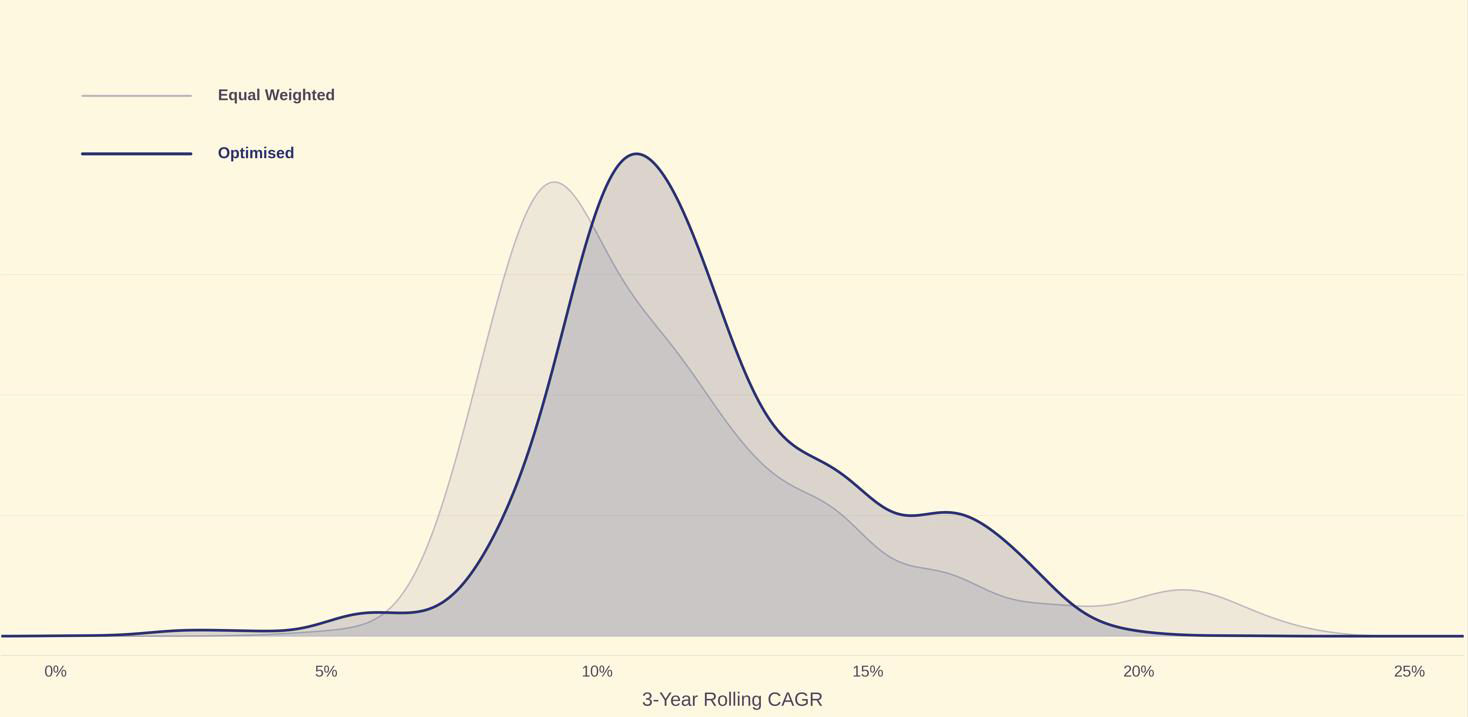
Average returns are misleading because what investors live through is every single rolling period. The distribution chart below overlays all 3-year rolling CAGR observations for both portfolios. The optimized portfolio’s distribution is narrower, its centre is shifted right and its left tail is materially smaller.
*Source: NSE & Investing.Com (Data from January 2011 to March 2026)
Portfolio optimisation is not about finding better assets. It is about getting more out of the assets you already hold. The equal weighted and optimised portfolios in this analysis share the same four building blocks. The difference is entirely in the weights, determined not by convention, but by the mathematical structure of how these assets relate to each other. Same assets; Better weights. A Sharpe ratio that improves by 35% while the probability of achieving a 12% CAGR rises from 31% to 40%. A floor outcome that improves from 8.2% to 9.1% even in the worst periods. Asset classes will rotate and markets will cycle, but the discipline of building around risk-adjusted return rather than arbitrary allocation is what separates a portfolio designed to last from one that merely hopes to.
DISCLAIMER: This report/presentation is intended for the personal and private use of the recipient and is for private circulation only. It is not to be published, reproduced, distributed, or disclosed, whether wholly or in part, to any other person or entity without prior written consent. The report/presentation has been prepared by Privus Advisors (Firm) based on the information available in public domain & other external sources which are beyond Privus’ control and may also include the Firm’s personal views. Though the recipient recognizes such information to be generally reliable, the recipient acknowledges that inaccuracies may occur & that the Firm does not warrant the accuracy or suitability of the information. Neither does the information nor any opinion expressed constitute a legal opinion or an offer, or an invitation to make an offer, to buy or sell any financial or other products / services or securities or any kind of derivatives related to such securities. Any information contained herein relating to taxation is based on the information available in the public domain that may be subject to change. Investors/Clients should refer to relevant foreign exchange regulations / taxation / financial advice as applicable in India and/or abroad about the appropriateness and relevance / impact of the views or suggestions expressed herein, related to any Investment/Estate Planning / Succession Planning. All investments are subject to market risks, read all related documents carefully before investing. The Firm is registered with SEBI as a non-individual RIA bearing Reg. No. INA000019752 & BSEASL membership No. 2230. Registration granted by SEBI, membership of BASL and certification of National Institute of Securities Markets (NISM) in no way guarantees performance of the intermediary or provide any assurance of returns to investors.