Investing often appears deceptively simple. Markets rise; investors chase returns and portfolios gradually become concentrated around the asset class that has performed best in recent memory. While this approach may work temporarily, history consistently shows that concentration is the biggest hidden risk in wealth creation. Diversification is often described as a basic investment principle. Yet true diversification is frequently misunderstood. It is not about owning multiple investments. It is about owning investments that behave differently under varying economic conditions. The strength of a portfolio lies not in how each asset performs individually, but in how assets perform together.
Owning multiple investments does not automatically create diversification. The real measure of diversification lies in how assets behave relative to each other. Correlation analysis of the major asset classes highlights a crucial insight; asset classes rarely move in lockstep. Each respond to distinct economic drivers such as growth, inflation, interest rates, liquidity and currency movements.
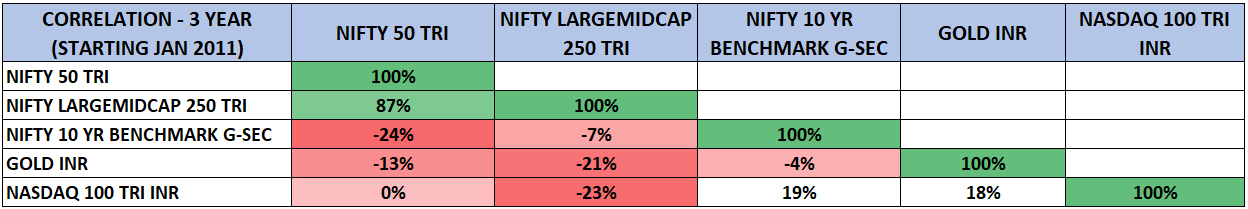
Source: Investing.com & NSE (Data as on 31ST January 2026 & considered since Jan 2011- start of Nifty 10YR G-Sec).
The correlation table above is plotted from daily 3-year rolling returns among major asset classes with initial data starting 3rd January 2011 to 31st January 2026. The daily 3-year rolling returns of NIFTY 50 TRI and NIFTY LargeMidcap 250 TRI exhibit a very high positive correlation of 87%. This means these assets tend to rise and fall in unison, offering limited diversification benefits when combined. In contrast, Gold INR shows negative correlation with Indian equities (-13% to -21%), while Nasdaq 100 INR displays nil to negative correlations (0% to -23%). Benchmark G-Sec (government securities) also maintains negative correlations with Indian equities (-27% to – 7%), however having low negative correlation with Gold INR (-4%) and Nasdaq 100 INR (19%). These low or negative linkages are the cornerstone of effective diversification. When equities falter due to domestic market pressures, Gold and Government securities often acts as a safe haven, preserving capital. Overseas indices like Nasdaq 100 INR, driven by global tech and innovation cycles, diverge from Indian markets influenced by local policy. Over three years, this decoupling proves invaluable for smoothing volatility.
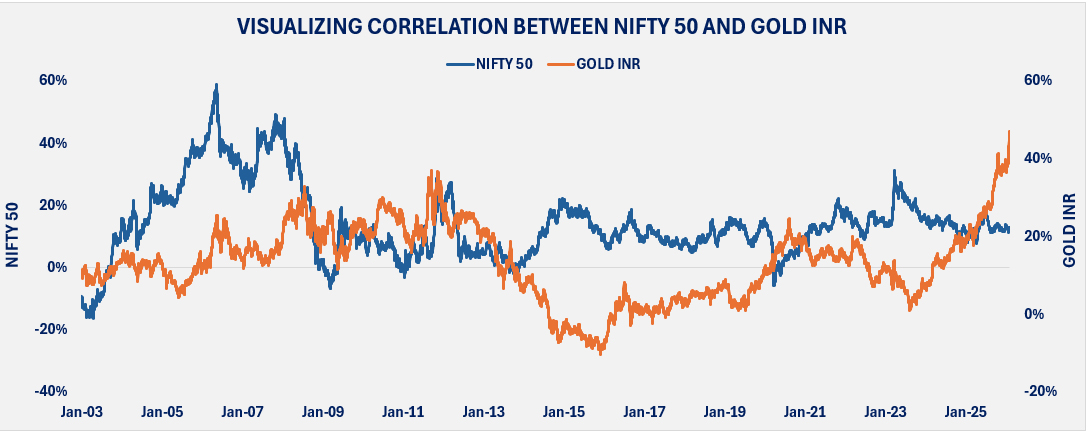
Source: Investing.com (Data as on 31st January 2026)
The chart above represents the inverse relationship of Nifty 50 and Gold INR on a daily 3-year rolling return basis with initial data starting 1st January 2000 to 31st January 2026. The relationship between the Nifty 50 and Gold INR illustrates diversification in action. Equities thrive during economic expansion, strong earnings growth and positive investor sentiment. Gold, however, typically strengthens during market stress, currency weakness and inflationary uncertainty. Both assets often move independently across cycles. This independence allows gold to cushion portfolios during equity volatility, enhancing overall portfolio stability without diluting long-term growth potential. Gold is therefore less a return driver and more a risk stabiliser.
The accompanying table details three strategic portfolios that allocate across equities, debt and alternative assets, with daily 3-year rolling returns data commencing 3rd January 2011 to 31st January 2026:
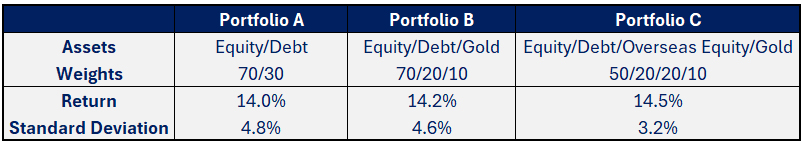
Source: Investing.com (Data as on 31st January 2026)
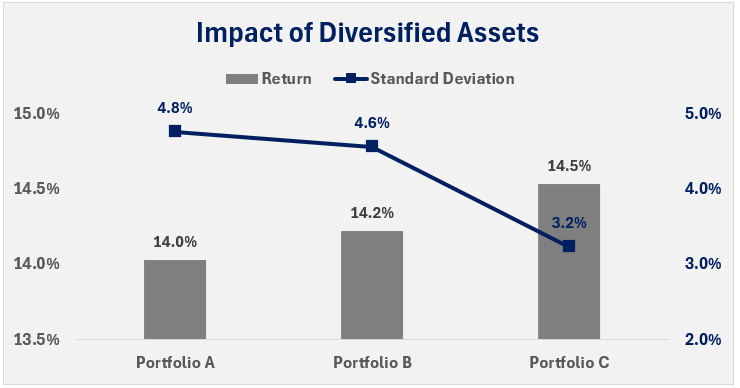
Diversification via uncorrelated assets isn’t about chasing returns – it’s risk mastery. Portfolios B and C prove you can inch returns higher (14.2-14.5%) while slashing volatility all the way down to 3.2%. A portfolio comprising Indian and global equities, debt and gold offers the diversification edge in today’s volatile world.
Asset allocation remains the most critical determinant of long-term portfolio outcomes. Individual investments will change. Market leadership will rotate. Economic cycles will evolve. A well-diversified portfolio adapts to these changes without requiring constant reinvention.
DISCLAIMER: This report/presentation is intended for the personal and private use of the recipient and is for private circulation only. It is not to be published, reproduced, distributed, or disclosed, whether wholly or in part, to any other person or entity without prior written consent. The report/presentation has been prepared by Privus Advisors (Firm) based on the information available in public domain & other external sources which are beyond Privus’ control and may also include the Firm’s personal views. Though the recipient recognizes such information to be generally reliable, the recipient acknowledges that inaccuracies may occur & that the Firm does not warrant the accuracy or suitability of the information. Neither does the information nor any opinion expressed constitute a legal opinion or an offer, or an invitation to make an offer, to buy or sell any financial or other products / services or securities or any kind of derivatives related to such securities. Any information contained herein relating to taxation is based on the information available in the public domain that may be subject to change. Investors/Clients should refer to relevant foreign exchange regulations / taxation / financial advice as applicable in India and/or abroad about the appropriateness and relevance / impact of the views or suggestions expressed herein, related to any Investment/Estate Planning / Succession Planning. All investments are subject to market risks, read all related documents carefully before investing. The Firm is registered with SEBI as a non-individual RIA bearing Reg. No. INA000019752 & BSEASL membership No. 2230. Registration granted by SEBI, membership of BASL and certification of National Institute of Securities Markets (NISM) in no way guarantees performance of the intermediary or provide any assurance of returns to investors.