Date: July 2025
Investors are constantly on the hunt for the best long-term asset to preserve wealth, beat inflation, and ride through market storms. Among the many options, precious metals like gold and silver are often compared with a country’s equity benchmark like the Nifty 50 Total Returns Index (TRI). But when it comes to actual performance, which of these performs better over time?
Let us look at a comparative analysis spanning multiple decades to find out which asset truly stands out. In investing, it’s important to know how different asset classes perform compared to each other when making decisions. In this post, we will dive into visual analysis of the 3-year rolling returns of silver, gold, and Indian equity indices, specifically the Nifty 50 TR, from early 2003 to 2025.
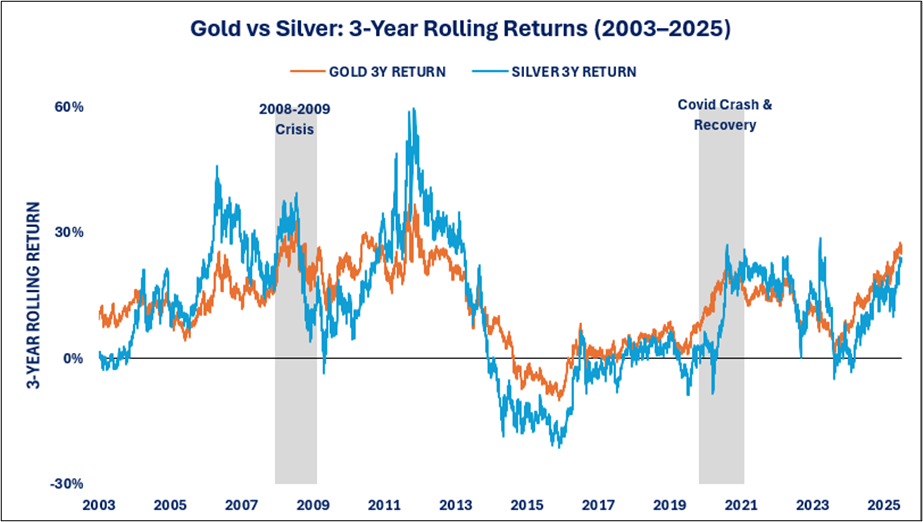
Source: Gold.org, Investing.com as on 30th June 2025 (Data Since 2000)
This chart presents the 3-year rolling returns of silver and gold, highlighting how they differ in their behaviour over time. Silver displays significantly higher volatility, with returns oscillating between +60% and -30%, whereas gold moves within a band of +30% to -10%. Regardless of the differences in volatility, the two assets are strongly correlated, having a correlation coefficient of 0.88, suggesting they generally move in tandem. During crisis periods, like the post-2008 recovery and the 2020 pandemic shock, both metals experienced significant gains of about 60% for silver and 30% for gold, strengthening their status as safe-haven assets during financial instability.
Nonetheless, these patterns of returns vary in character. Gold provides more stable and uniform returns, i.e., follows a more predictable and consistent path, whereas silver shows peaks and troughs, a manifestation of its more volatile and speculative nature. This is supported by their respective standard deviations of 0.16 for silver and 0.103 for gold, indicating that silver deviates more significantly from its average return. There’s also a noticeable lag and amplification effect: silver responds to gold but in an amplified way where it rises quickly in uptrends and more precipitously in downturns.
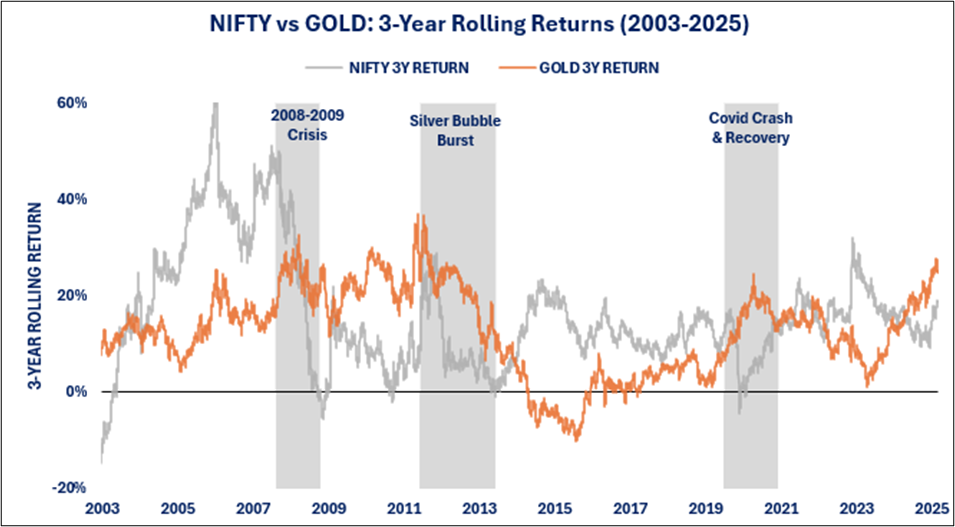
Source: Gold.org, Niftyindices.com as on 30th June 2025 (Data Since 2000)
This chart compares gold with the Indian equity benchmark Nifty 50 Total Returns Index (TR), and what one sees are different performance trends. During times of crises such as 2008 and 2020, gold rose sharply, reflecting its traditional role as a crisis hedge. While Nifty returns fell in 2008 and 2020 but came back quite strongly afterwards. On longer terms, NIFTY has provided higher potential for returns with stronger cycles, whereas gold has provided lesser but steadier returns, especially during turbulent global periods. Both asset classes tend to move inversely, reflecting their low correlation.
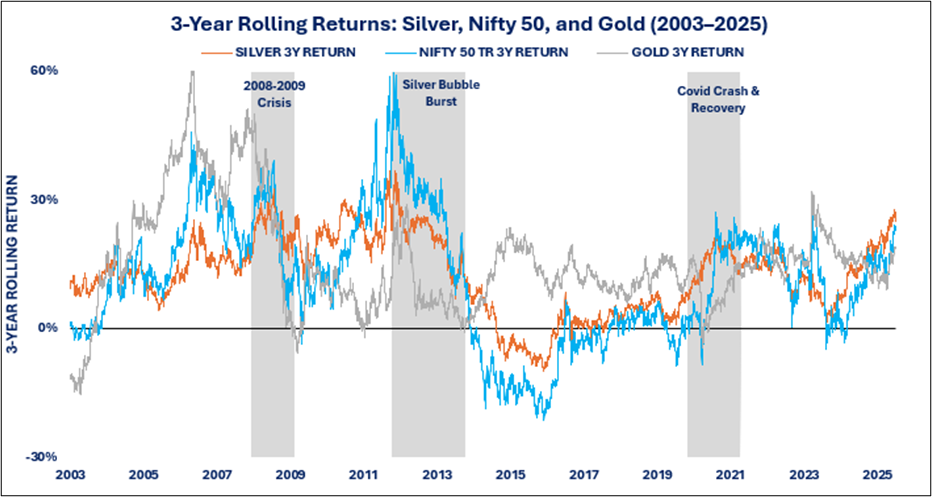
Source: Gold.org, Investing.com, Niftyindices.com as on 30th June 2025 (Data Since 2000)
The comparison highlights the unique behaviour of gold, silver, and the Nifty 50 TR across different market cycles. Gold shows relative steadiness with moderate and consistent returns irrespective of overall market conditions. Silver, however, continues to be extremely volatile, soaring by up to 60% before plummeting, indicating its volatile nature. The Nifty 50 TR, meanwhile, has depicted robust and sustained outperformance, more so after 2014, in sync with the recovery of India’s economy as well as corporate earnings.
Regarding correlations, gold and Nifty 50 TR have a very weak correlation (0.04), which further supports gold as a non-correlated, defensive asset. Silver has a weaker but slightly higher correlation with the index at 0.32. These numbers indicate that equities reflect market sentiment and economic growth, but precious metals, especially gold, act more as safe-haven assets in times of doubt or volatility.
Silver, as much as it can increase returns, is not only demanding in terms of risk management because it is highly volatile but also deserves tactical allocation. Gold, however, is the best hedge during times of geopolitical and economic turmoil, as it brings stability when markets are volatile. Nifty 50 TR is the best core holding, the one that brings somewhat stable and steady long-term growth. Examining 3-year rolling returns offers further analysis by reducing near-term volatility, uncovering cycle trends, and assisting with effective entry and exit points for all asset classes.
DISCLAIMER: This report/presentation is intended for the personal and private use of the recipient and is for private circulation only. It is not to be published, reproduced, distributed, or disclosed, whether wholly or in part, to any other person or entity without prior written consent. The report/presentation has been prepared by Privus Advisors (Firm) based on the information available in public domain & other external sources which are beyond Privus’ control and may also include the Firm’s personal views. Though the recipient recognizes such information to be generally reliable, the recipient acknowledges that inaccuracies may occur & that the Firm does not warrant the accuracy or suitability of the information. Neither does the information nor any opinion expressed constitute a legal opinion or an offer, or an invitation to make an offer, to buy or sell any financial or other products / services or securities or any kind of derivatives related to such securities. Any information contained herein relating to taxation is based on the information available in the public domain that may be subject to change. Investors/Clients should refer to relevant foreign exchange regulations / taxation / financial advice as applicable in India and/or abroad about the appropriateness and relevance / impact of the views or suggestions expressed herein, related to any Investment/Estate Planning / Succession Planning. All investments are subject to market risks, read all related documents carefully before investing. The Firm is registered with SEBI as a non-individual RIA bearing Reg. No. INA000019752 & BSEASL membership No. 2230. Registration granted by SEBI, membership of BASL and certification of National Institute of Securities Markets (NISM) in no way guarantees performance of the intermediary or provide any assurance of returns to investors.