Date: Aug 2025
In investment analysis, numbers can be deceptively flattering. A fund showing 20% gains over the past year might appear impressive at first glance, but without understanding how those returns were generated, the picture remains incomplete. Were the gains consistent across the year, or did they come from a brief market upswing that masked periods of underperformance? To answer such questions, investors need a metric that looks beyond point-to-point snapshots and that’s where rolling returns become indispensable.
Rolling returns are the annualized average returns of an investment calculated over overlapping periods of a specific timeframe. Unlike traditional point-to-point returns that only consider two fixed dates, rolling returns provide a continuous, dynamic view of performance by “rolling” the observation window forward at regular intervals. Think of it as taking multiple snapshots of your investment’s performance over time, rather than relying on a single photograph. If you want to assess a fund’s 3-year performance over a 10-year period, rolling returns would calculate the 3-year return for every single day within that decade giving you around 3,664 data points instead of just one.
Source: NSE (Data as on 10th August 2025)
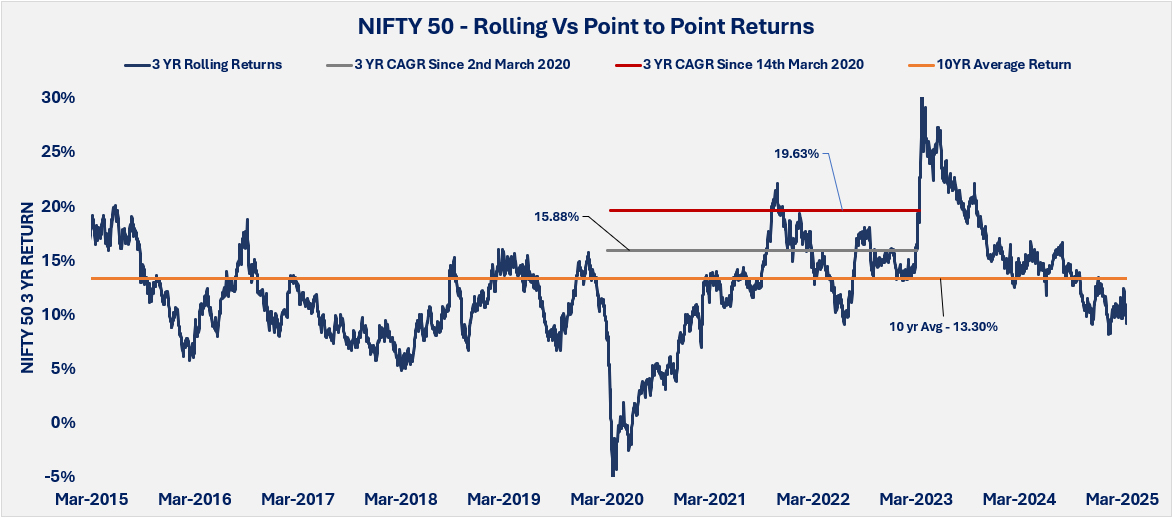
The chart above illustrates Nifty’s 3-year holding period returns for 10 years, calculated daily. First return calculated from 1st Mar 2015 to 1st Mar 2018, second from 2nd Mar 2015 to 2nd Mar 2018 and so on till the last return calculated from 1st Mar 2022 till 1st Mar 2025. An investment made on 2nd March 2020 held for three years delivered a CAGR of 15.88%, while an investment made just 12 days later, on 14th March 2020, has delivered 19.63%. A new investor evaluating the index on these two dates in 2023 would see a 4% difference in annualized returns, purely due to the choice of start and end dates. This demonstrates how point-to-point analysis can be misleading or incomplete. Rolling returns address this limitation by examining returns across every possible cycle for the holding period, providing a truer picture of consistency. The average of the annualized returns (rolling return), for 3-year holding period, stands at 13.3% – a far more reliable benchmark for investor expectation than isolated outcomes.
At Privus Advisors, we emphasize rolling returns as a critical lens for evaluating investments. Investors who incorporate this metric are better equipped to set realistic expectations, select funds aligned with their risk tolerance, and stay disciplined through market volatility.
Next time you review a fund, look beyond “what was the return?” and ask, “what do the rolling returns reveal?” That shift can make all the difference in building portfolios aligned with long-term goals.
DISCLAIMER: This report/presentation is intended for the personal and private use of the recipient and is for private circulation only. It is not to be published, reproduced, distributed, or disclosed, whether wholly or in part, to any other person or entity without prior written consent. The report/presentation has been prepared by Privus Advisors (Firm) based on the information available in public domain & other external sources which are beyond Privus’ control and may also include the Firm’s personal views. Though the recipient recognizes such information to be generally reliable, the recipient acknowledges that inaccuracies may occur & that the Firm does not warrant the accuracy or suitability of the information. Neither does the information nor any opinion expressed constitute a legal opinion or an offer, or an invitation to make an offer, to buy or sell any financial or other products / services or securities or any kind of derivatives related to such securities. Any information contained herein relating to taxation is based on the information available in the public domain that may be subject to change. Investors/Clients should refer to relevant foreign exchange regulations / taxation / financial advice as applicable in India and/or abroad about the appropriateness and relevance / impact of the views or suggestions expressed herein, related to any Investment/Estate Planning / Succession Planning. All investments are subject to market risks, read all related documents carefully before investing. The Firm is registered with SEBI as a non-individual RIA bearing Reg. No. INA000019752 & BSEASL membership No. 2230. Registration granted by SEBI, membership of BASL and certification of National Institute of Securities Markets (NISM) in no way guarantees performance of the intermediary or provide any assurance of returns to investors.